Is there a geographical difference in UK school performance?
By Ben Smith
Published 18 Feb 2016
The media often draws comparisons between geographical location and educational outcomes. Recent reports have warned that coastal schools are underperforming, and suggested that there is a 'North-South divide' in exam attainment. These are provocative claims that deserve rigorous evaluation.
A ubiquitous attainment measure used in analysis published by SchoolDash is: 'the proportion of pupils in a school who attained five A*-C GCSE grades, including English and Maths'. While this measure was, until recently, a headline measure of attainment, it does not accurately reflect achievement. For example, let's consider the claim that fewer candidates in the North meet the five A*-C criteria. It's possible that all students in the North who pass the 'five A*-C' hurdle could get 11 A*s, while all students who pass the hurdle in the South could get five Cs. Based on this measure alone, the South would still be perceived as the 'better' performer. A measure such as the average points score where a pupil's best eight GCSE grades are converted into points, and then averaged would enable a more informed analysis.
Two major factors to consider when assessing exam results are the prior attainment of pupils, and levels of socio-economic deprivation. If a pupil is very able (based on Key Stage 2 scores), it is more likely that they will do better in their GCSEs than less able pupils (this is one of the key reasons for including value-added measures in school performance tables). Similarly, it's been found that pupils from affluent backgrounds tend to perform better than those who are socio-economically deprived. Unless we adequately control for such factors, how do we know whether the 'North-South divide' is merely telling us, for example, that there are higher levels of deprivation in the North, which affect school performance? If we had a clearer picture, we could shift the focus from the existence of this underperformance to the causes of it; a better understanding would allow us to address the factors that underlie regional inequalities.
Below are some maps of the mean average points score in local authorities in England (in 2014, obtained from the Department for Education's school performance tables). Schools have been allocated to a free school meals (FSM) band (High FSM band = schools with >40% of pupils eligible for FSM, Low FSM band = schools with <20% of pupils eligible for FSM) in a crude attempt to control for the proportion of pupils in each school who experience socio-economic deprivation. Each map shows a different group of schools that have similar levels of deprivation, based on the FSM band allocated.
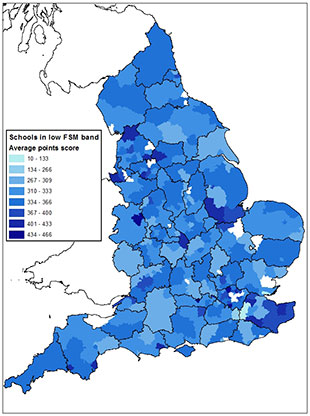
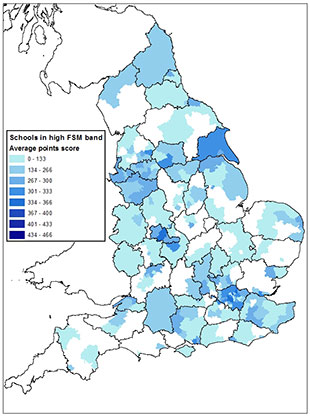
Using this measure splitting data by deprivation levels, and using a lower level of aggregation it's very difficult to discern a North-South divide in school attainment. However, this analysis does not explain why performance differs across regions; splitting the data into groups is a poor substitute for adequate statistical controls.
This is not to say that analysing data by location is pointless. Recent work by the Social Market Foundation suggests that educational inequalities do exist between regions and they are widening over time. TES recently published an article that cited work by Dr Becky Allen of the Education Datalab. She found that when contextual variables are taken into account, the North-South divide vanishes, with the North-East actually emerging as one of the best performing regions in the country.
My colleague Yaw Bimpeh and I have recently been trialling 'spatial analyses' for educational data. This is the catch-all term for a group of techniques that, to our knowledge, have only been used on education data once before (back in 2001). Spatial analyses differ from other techniques that incorporate location information in that they factor in the precise location of a data point (here, a school). Typically, in techniques such as multilevel modelling, location is merely captured as categories a school may be part of Camden borough, the Greater London county, and the South-East region, for example. Therefore, spatial analyses can be expressed in map format, rather than being constrained to tables and charts. We presented our findings at the recent AEA-Europe conference in Glasgow. We hope that, with further work, techniques such as spatial analyses will be able to provide a more nuanced evaluation of regional differences that goes beyond the 'North-South divide'.
Ben Smith
The Sutton Trust's recent Background to Success report provides a detailed breakdown of education in England by regions and other demographic factors, while incorporating statistical controls.
ARCMap 10.0 was utilised to perform geographically weighted regressions and produce the maps in this article.
Keywords
Related content
- Where’s the value in ‘value-added’?
- Let’s stop talking about summer learning loss
- Covid-19 school closures: student experiences of online learning
About our blog
Discover more about the work our researchers are doing to help improve and develop our assessments, expertise and resources.
Share this page
Connect with us
Email: research@aqa.org.uk
Work with us to advance education and enable students and teachers to reach their potential.