Specifications that use this resource:
Teaching guide: decision trees
Provides an example of scientific decision making.
Model/theory
Key points
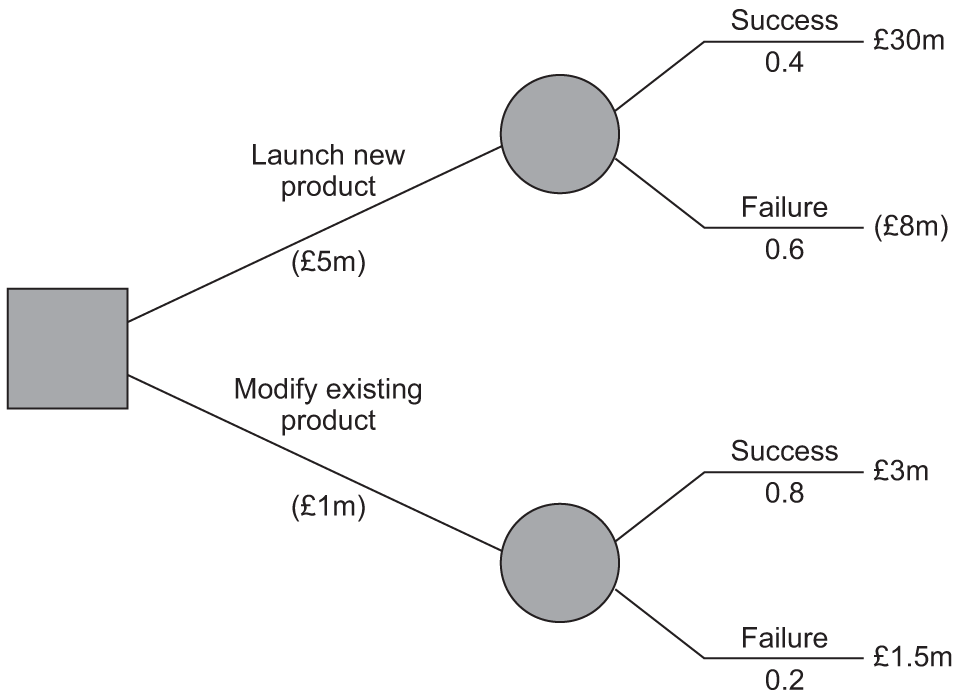
- A square represents that a decision has to be made.
- The lines coming from the square represent the possible choices.
- The circles show that there are outcomes as a result of a choice.
- The lines coming from a circle show the expected outcomes.
- The probability shows the estimated likelihood of a given outcome.
- The probability of all outcomes must add up to 1.
- The Expected Value (EV) shows the weighted average of a given choice; to calculate this multiply the probability of each given outcome by its expected value and add them together eg EV Launch new product = [0.4 x 30] + [0.6 x -8] = 12 - 4.8 = £7.2m.
- The Expected Value is the average outcome if this decision was made many times.
- The Net Gain is the Expected Value minus the initial cost of a given choice. Net Gain of launching new product = £7.2m - £5m= £2.2m.
- To compare this Net Gain with the Net Gain of other choices, eg Net Gain of Modify existing product = [0.8 x 3] + [0.2 x 1.5] = 2.7 -1 = £1.7m.
- Decision based on choice with highest net gain which is to launch new product [£2.2m as against £1.7m].
When you can use this
When discussing important concepts in decision making such as choices, opportunity cost, probability and risk, costs and returns, net gains, expected outcomes and forecasting you could consider:
- the value of decision trees in getting managers to think through their options, the probability of different outcomes and the financial consequences
- the extent to which the financial consequences of an outcome can be accurately estimated and whether outcomes are best measured in financial terms
- issues could be considered in decision making such as raising the initial finance, the impact of ethics and the impact on stakeholders.
Where it's been used
-
Q15.2, AS paper 1, 2017
-
Q12, AS paper 1, 2016
-
Q13, AS paper 1, SAM set 1